

The service technician completes the call-out at the customer’s premises, writes the report on paper and drives off to the next appointment. In the evening, the office staff enter the details into the system; any missing information triggers follow-up calls. Each of these loops costs working time, and they are repeated with every service call. To reduce process costs, every organisation starts by taking stock: what steps are involved in a single service call, and how much effort does each one require? Process costs per service call include planning, travel, documentation, follow-up work and invoicing. Hours and euros can be quantified for each of these items, and further calculations are based on this.
Key points at a glance
- Reducing service process costs starts with an assessment of planning, travel, documentation, follow-up work and invoicing for each call-out.
- The potential savings can be estimated using Innosoft’s ROI calculator based on four figures, but this remains a non-binding estimate that does not include licence, implementation or operating costs.
- Digital measures such as shift planning, mobile reporting and ERP integration reduce duplicate data entry, whilst key performance indicators such as time per call-out show whether process costs are falling.
Reducing process costs in technical support: where the effort lies
A faulty sensor can be replaced quickly at the customer’s premises. What happens before and after that does not appear on any invoice: arranging an appointment, travelling to the site, writing a report, data entry, invoicing. If you want to reduce process costs in technical support, the first step is to look at these stages. Five of them occur during every call-out and can be quantified individually.
Planning and scheduling prior to the call-out
Before every call-out, scheduling must determine which technician has the appropriate qualifications and when they are available. If coordination takes place via telephone, Excel and follow-up enquiries, every rescheduling takes up time in the office. If a technician is unavailable at short notice, the coordination process starts all over again.
Travel and journey time
Journey time counts as working time, even though the technician is not yet at the site. Unfavourable routes or a sequence of appointments with overlapping journeys extend this time without any benefit to the customer. Added to this is the journey back to the warehouse if a spare part is missing.
Service reports and time recording on site
Handwritten reports take time to write and to transcribe later. If working hours are only recorded retrospectively, they are inaccurate. Furthermore, without an internet connection on site, there is no access to order data and system history.
Re-work and duplicate data entry in the back office
In the back office, reports arrive as paper documents, photos or PDFs. Someone has to manually enter material consumption, working hours and findings into the ERP system. If any details are missing, the back office staff ring the technician, who is by then working at the next customer’s site. The result is duplicate data entry and follow-up enquiries that bring no benefit to the customer.
Settlement and invoicing
Invoices cannot be issued until all details regarding materials and working hours are available. Any delay pushes back the invoicing process and, consequently, the receipt of payment. If the details do not match the job, additional work is required to correct them.
Reducing process costs: Calculating potential savings per service call
Process costs are the costs incurred during a business process; in the context of a service, these include planning, travel, documentation, follow-up work and invoicing for a call-out. Process cost accounting is the method used in management accounting to allocate overheads to processes via cost drivers. This has nothing to do with the court and legal fees associated with a legal dispute, which are also referred to as ‘process costs’ in a legal sense. The calculation requires just four pieces of information that every service organisation is familiar with. These reveal how many hours per month and per year are freed up if individual steps are completed more quickly. This allows the potential savings to be expressed in terms of time, call-outs and full-time staff.
Calculating the potential savings – these are the four figures you need
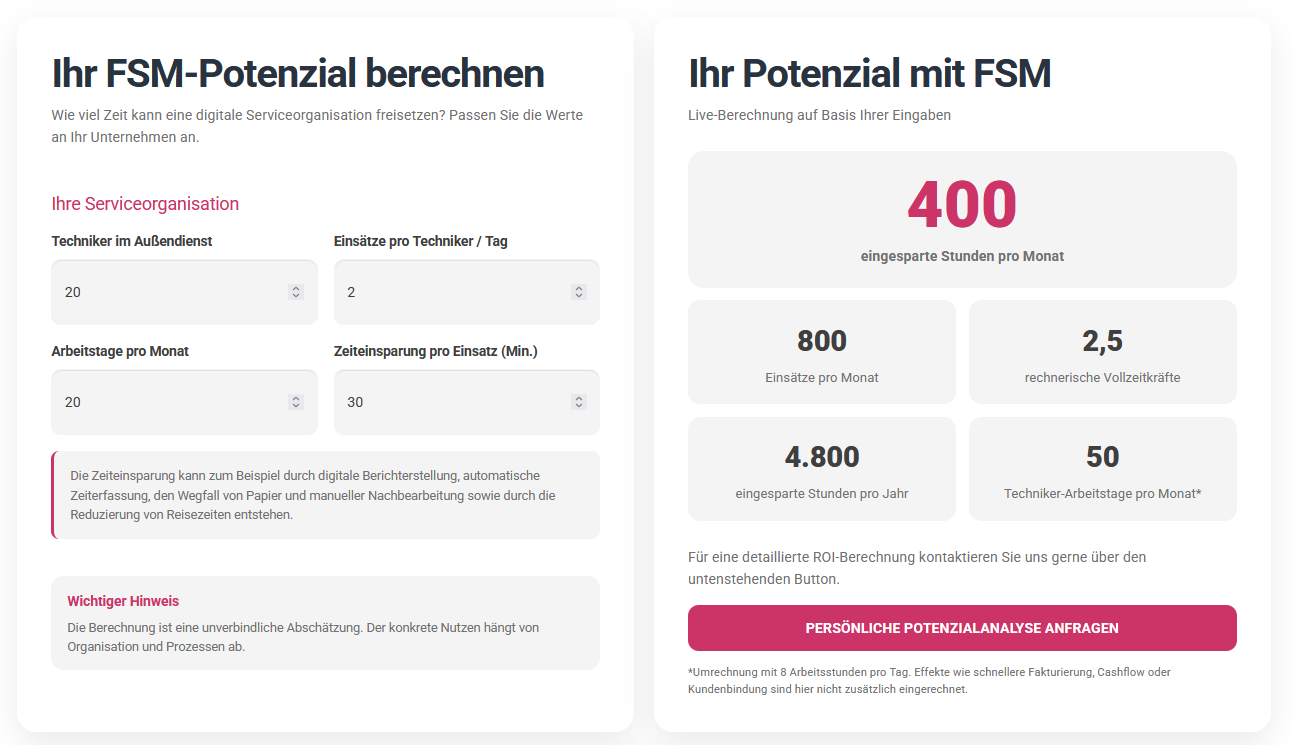
Four figures are sufficient: field technicians, assignments per technician per day, working days per month, and the time saved per assignment in minutes. Three of these figures are provided by resource planning. The time saved is more difficult to quantify, as it is an estimate. It stems from processes such as digital reporting, automatic time recording, the elimination of paper, less follow-up work and shorter travel times.
Sample calculation using Innosoft’s ROI calculator
In the Innosoft ROI calculator, you enter these four figures and see the result immediately. Here’s an example using hypothetical figures: 20 technicians carry out two call-outs per day, work 20 days a month and save 30 minutes per call-out. This amounts to 800 call-outs and 400 hours per month, or 4,800 hours per year. Based on an eight-hour working day, this equates to 50 technician working days per month, or the equivalent of 2.5 full-time staff. The calculator identifies the benefits as increased capacity, faster response times, improved service quality and a reduced workload for the back-office team.
From hours to euros: the impact of the hourly rate
To calculate the legal costs in euros, the invoice requires an hourly rate:
Annual savings = number of technicians × number of call-outs per day × number of working days × minutes per call-out ÷ 60 × 12 × hourly rate
Based on the example above, assuming three hourly rates, this gives the following figures:
| Hourly rate | Time saved per year | Value per year |
| 50 € | 4.800 h | 240.000 € |
| 60 € | 4.800 h | 288.000 € |
| 70 € | 4.800 h | 336.000 € |
What the calculation does not reflect
The result remains non-binding even when using your own figures, as the benefits depend on your organisation and processes. Faster invoicing, cash flow and customer loyalty are not factored in. Nor does the calculation include costs for licences, implementation and operation. Rather than a process cost analysis, it provides an estimate of the working time that digital workflows free up per task. For a detailed ROI calculation, Innosoft offers a personalised potential analysis.
Calculate the potential savings for your service
Enter the number of technicians, assignments and time saved, and see the result in hours and full-time equivalents.
What measures reduce process costs in the field service?
To reduce process costs in the field service, a single step is rarely enough. Cost drivers lie in planning, travel, documentation, rework and invoicing, and each of these can be addressed with a specific measure. Six measures cover these steps, and most of them are based on the same order data. Which of these is most worthwhile depends on the organisation. The time saved per call-out, as shown in the calculation example, serves as a benchmark:
- Call-out planning with automatic qualification checks: When allocating appointments, the system checks whether the technician’s qualifications and availability match the requirements of the site. This eliminates the need for telephone calls and list comparisons in the dispatch department. Enquiries and rescheduling by the office staff are reduced. Technicians are less likely to travel to a site for which they lack the necessary qualifications.
- Automated route planning: The software organises the day’s appointments so that journeys are shorter. Travel time counts as working time, so every minute saved on travel reduces the cost per call-out. Shorter journeys also save on travel costs.
- Service report completed directly at the customer’s premises: Technicians record working time, materials and findings on a tablet or smartphone whilst they are still at the site. There is no need for handwritten notes or entries made retrospectively. With offline access, this works even without a network connection, and job data and system history are still available. The office staff receive the report immediately and do not need to retype it.
- Centralised job data and invoicing: Schedulers, technicians and the accounts department all access the same data. Inconsistencies that need to be corrected later become less common. Invoices can be issued sooner, as details of materials and labour are fully available once the job is complete. Consequently, payment is received sooner.
- ERP integration instead of double data entry: Orders, time records and materials are transferred back and forth between the FSM system and the ERP system via an interface. No one has to re-enter data. This also eliminates errors caused by typing and data transfer.
- AI text assistant in the service report: An AI assistant helps with drafting the service report. Technicians spend less time writing themselves, and the report is completed more quickly. The time saved becomes apparent in practice and can be measured by the time taken per service report.
Reducing process costs with FSM software: features and benefits of Innosoft
FSM software such as Innosoft brings together the planning, documentation and invoicing of a service call within a single system. This reduces process costs because data is entered only once and each step builds on the previous one. Innosoft has been developing this software for the mechanical and plant engineering sector since 1996.
Functions throughout the service call
Every step of a service call has its own dedicated function in Innosoft, which reduces the workload at that stage:
| Cost Driver | Innosoft Feature | Benefit for Process Costs |
| Scheduling and Dispatching | Visual scheduling in a Gantt chart, recommendation of the most suitable technician based on utilization and skills | Less coordination via phone calls and spreadsheets |
| Travel | Locations and routes via Google Maps, proximity search for emergency assignments, travel planning including hotels and transportation | Routes and locations are visible during planning |
| On-Site Documentation | Mobile app with offline functionality, digital time tracking, photo uploads, and QR code scanning for spare parts | Data is recorded directly on-site instead of afterward |
| Service Reports | AI text assistant: turns bullet points into a complete report, with optional translation while keeping the original text accessible | Less writing effort for technicians and less rework for back-office staff |
| Billing | Digitally signed proof of service, automatically sent to the customer, with data transferred to the ERP system after approval | Service data is transferred without manual re-entry, often enabling invoicing on the same day, according to Innosoft |
| Performance Monitoring | Business Information with First-Time Fix Rate and Mean Time to Repair tracked over time, planned vs. actual comparisons, and export to Excel or PDF | KPI development can be measured and tracked over time |
Integration into the ERP landscape
The software can also be used as a stand-alone solution, but it is designed for existing system landscapes. A customer order approved in the ERP or CRM system appears as a task in the planning module, complete with spare parts and service level agreements. Once approved by the back office, time records, cash outlays and spare parts are fed back into the ERP system, enabling invoicing and cost accounting to be based on this data. Master data from the third-party system is synchronised within a few minutes. Custom programming is largely unnecessary, as a standardised ReST API is available.
Less follow-up work between the job and invoicing
Handwritten reports and typing them up take up office staff’s working time. Using the mobile app, technicians record time, materials and reports directly whilst on site with the customer; once approved, the data is sent to the ERP system.
Six key performance indicators that demonstrate a reduction in service process costs
To reduce process costs and demonstrate success, every measure requires a metric to be measured both before and after its introduction. Six key performance indicators cover the cost drivers identified in the first section:
| KPI | What It Measures | Cost Driver |
| Time per Service Visit | Total travel, waiting, and working time, in minutes | All steps |
| Travel Time per Service Visit | Share of travel time in the total time spent | Travel |
| Utilization Rate | Share of scheduled and productive time per technician | Scheduling and Dispatching |
| First-Time Fix Rate | Percentage of service visits completed on the first visit | Travel and Follow-up Visits |
| Time to Invoice | Time between completion of a service visit and invoicing | Billing |
| Reports Requiring Clarification | How often back-office staff need to request clarification | Rework |

Baseline assessment, pilot, training, roll-out: gradually reducing process costs in service operations
The introduction of FSM software only reduces process costs if it is implemented in stages with clear objectives. Between project approval and going live, there are coordination tasks, tests, approvals, training, data preparation and interface integration. Each of these phases can take time and delay cost savings if objectives and responsibilities are unclear. Four steps ensure the project remains measurable:
- As-is analysis: First, service organisations measure the time and costs associated with planning, travel, reporting, follow-up work and invoicing for each call-out. These figures form the starting point for the key performance indicators outlined in the previous section. Key users from dispatch, technical support and back-office teams should be involved in the process definition workshops from the outset.
- Pilot with measurable targets: A pilot involving selected test cases highlights weaknesses at an early stage. Before going live, key users test the new processes under real-world conditions. The target is set in advance – for example, a reduction in time per call-out compared to the baseline.
- Training: Training sessions explain the processes and their rationale, not just how to use the system. Trained key users pass on this knowledge to the rest of the team.
- Roll-out and monitoring: The roll-out takes place in stages with time buffers rather than following a rigid schedule. Subsequently, analyses compare target and actual figures, and, where necessary, workshops on integration and adjustments follow. Without a designated point of contact and clear responsibilities, this step often stalls.
Conclusion: Reducing field service costs with FSM software
Reducing service costs does not require a complete overhaul, but rather a focus on five key stages of the repair process: planning, travel, documentation, follow-up work and invoicing. Just four pieces of information are enough to quantify the potential savings per service call in hours, full-time equivalents and euros. A FSM browser-based solution such as Innosoft focuses on these same steps. Dispatch, a mobile app, ERP integration and an AI text assistant keep the data within a single system and prevent duplicate data entry. Key performance indicators such as time per call and first-time fix rate show whether the change is having an effect.
Frequently Asked Questions about Service Costs
Process costs are the costs incurred in connection with a service call, i.e. for planning, travel, documentation, follow-up work and invoicing. In field service management, service organisations calculate these costs on a per-call basis, as this allows changes to be quantified individually. These should be distinguished from the court and legal fees associated with a legal dispute, which are also referred to by the same term in a legal context.
Costs arise right from the planning stage, when appointments are coordinated and rescheduled via telephone and lists. Added to this are travel time, handwritten reports that are later transferred to the ERP system, queries regarding missing information, and delayed invoicing. Duplicate data entry and rescheduling occur with every assignment and therefore add up.
To calculate the process costs per call-out, service organisations first measure the time taken for each step: planning, travel, reporting, follow-up work and invoicing. An hourly rate converts this time into a euro amount. The potential savings from a measure are calculated based on the number of technicians, the number of call-outs per day, the number of working days and the time saved per call-out.
The ROI calculator requires four pieces of information: field technicians, call-outs per technician per day, working days per month, and the time saved per call-out in minutes. It performs real-time calculations and displays the hours saved per month and per year, call-outs per month, full-time staff, and technician working days. The calculation is based on eight working hours per day, and the result is a non-binding estimate that does not take into account factors such as faster invoicing or cash flow.
The trends are illustrated by the time per call-out, travel time per call-out, utilisation rate, first-time fix rate, time to invoice and the proportion of reports requiring further enquiries. Innosoft provides an analysis of the first-time fix rate and mean time to repair over time and compares these with the pre-defined targets. A baseline figure prior to implementation is required; otherwise, it is not possible to quantify any change.